Project study / Security
Prototype
Hayabusa
Local-first security detection platform processing Windows Event Logs through a streaming pipeline into ClickHouse-powered detections.
A detection-focused system built around local control, inspectable pipelines, and operationally honest security workflows.
System study / 01
Windows event data, carried through an inspectable local pipeline.
- Windows Event Logs
- PowerShell Exporter
- Vector
- NATS
- Go Ingestor
- ClickHouse
ClickHouse keeps event history close to SQL-driven detection work.
- ClickHouse
- SQL Rules
- Detections
- Alerts
Operator visibilityClickHouse-backed history and SQL-driven detections make it easier to iterate on rules while keeping data access fast and operator-readable.
01 / Problem and response
Keep the detection path inspectable.
Constraint
Security teams need pipelines they can inspect and control locally, especially when event volume, network assumptions, or deployment constraints make hosted-first approaches a bad fit.
The challenge is not just collecting Windows events, but moving them through a pipeline that remains debuggable while still supporting query performance and iterative detections.
Approach
Hayabusa keeps collection, streaming transport, storage, and detections close to the operator so the full system can be reasoned about in real operational conditions.
The pipeline is designed to make event movement observable, preserve replay-friendly storage in ClickHouse, and support SQL-driven detections without forcing a heavyweight control plane.
02 / Architecture boundaries
Separate collection, transport, history, and detection.
Windows endpoint collection and normalization pipeline with explicit flow into streaming transport.
Vector and NATS provide movement and buffering across the pipeline before events land in ClickHouse.
Detections are designed around queryable event history and operator visibility rather than hidden rule execution.
- 01
Pipeline stages are kept explicit so transport failures, storage pressure, and normalization problems can be debugged independently.
- 02
ClickHouse is used as a practical analytical store because detection work benefits from fast iteration on historical event queries.
- 03
Local-first constraints shape deployment and ergonomics, but they also improve operator trust in the system.
Implementation evidence
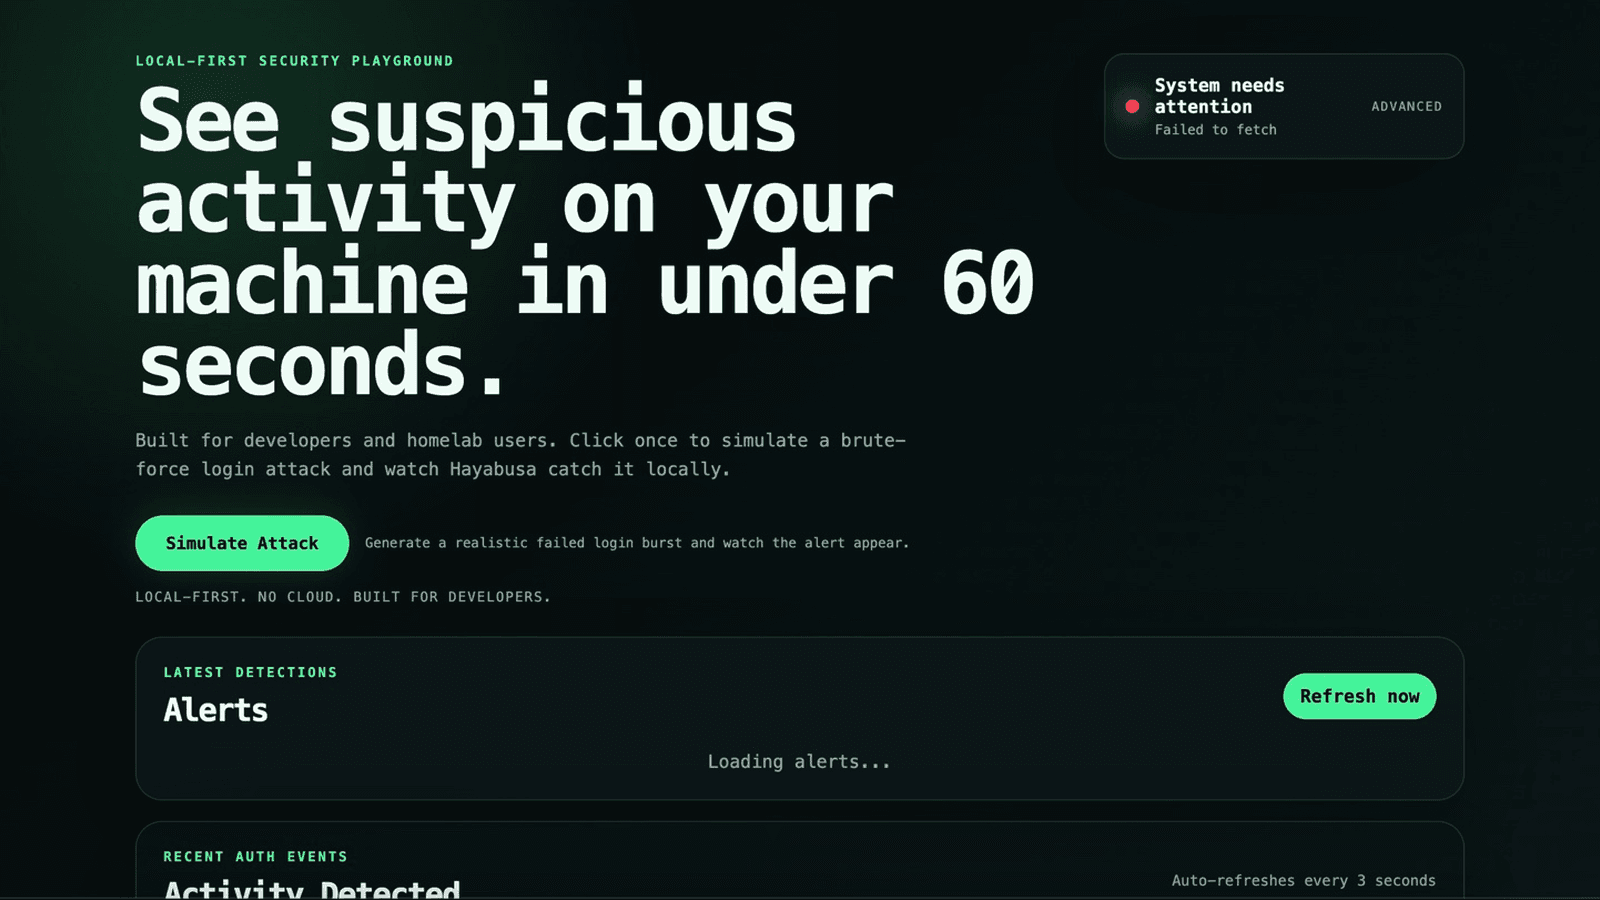
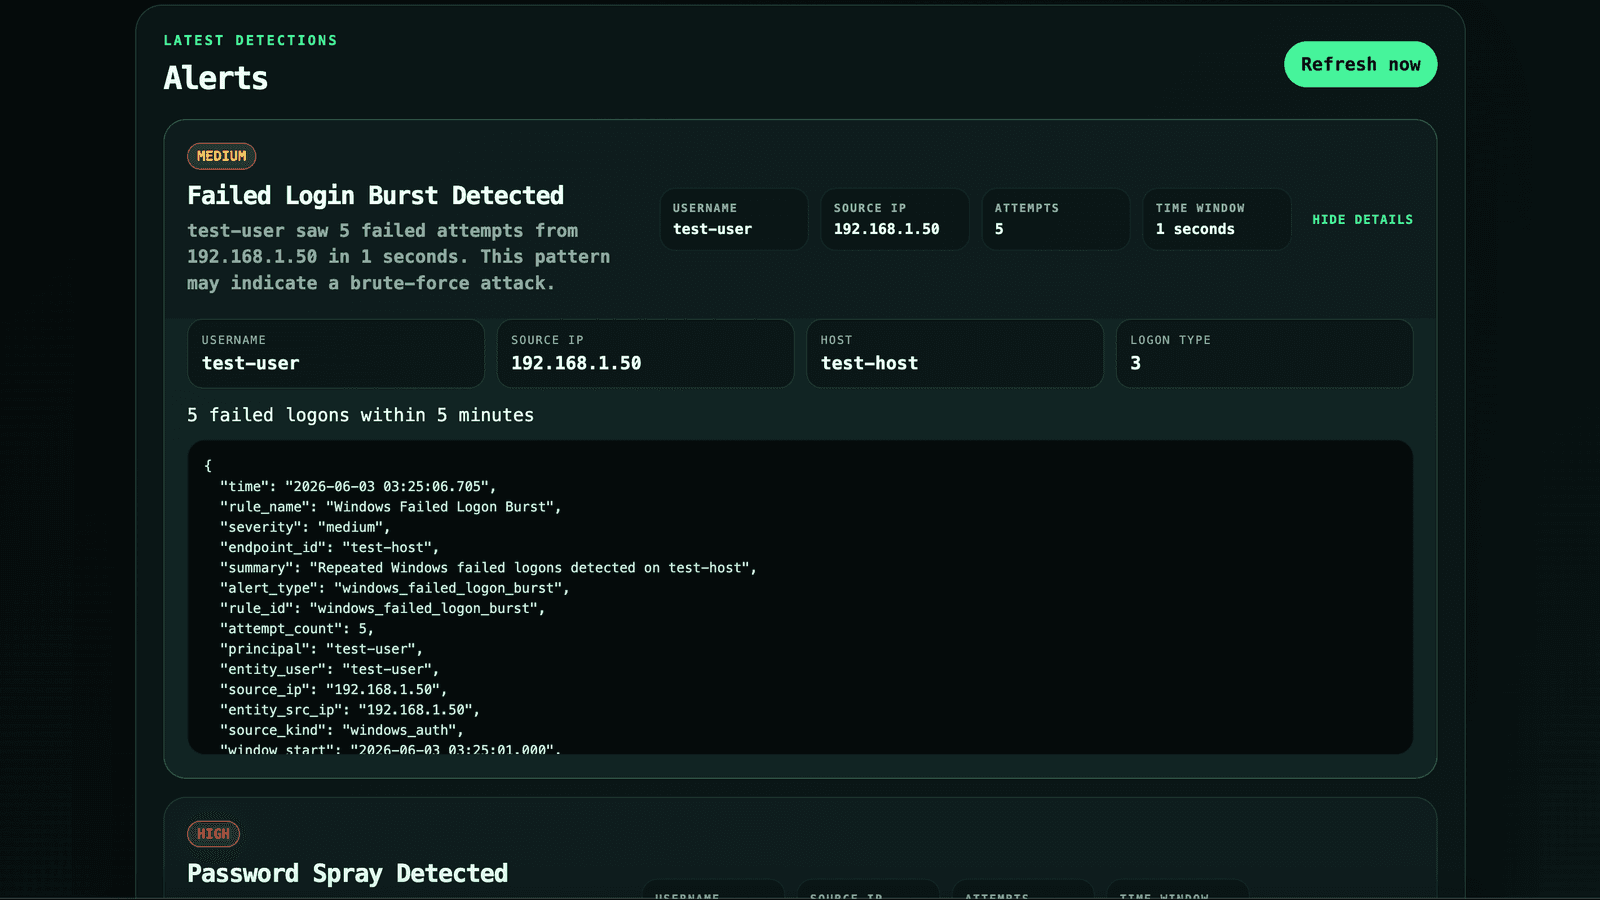
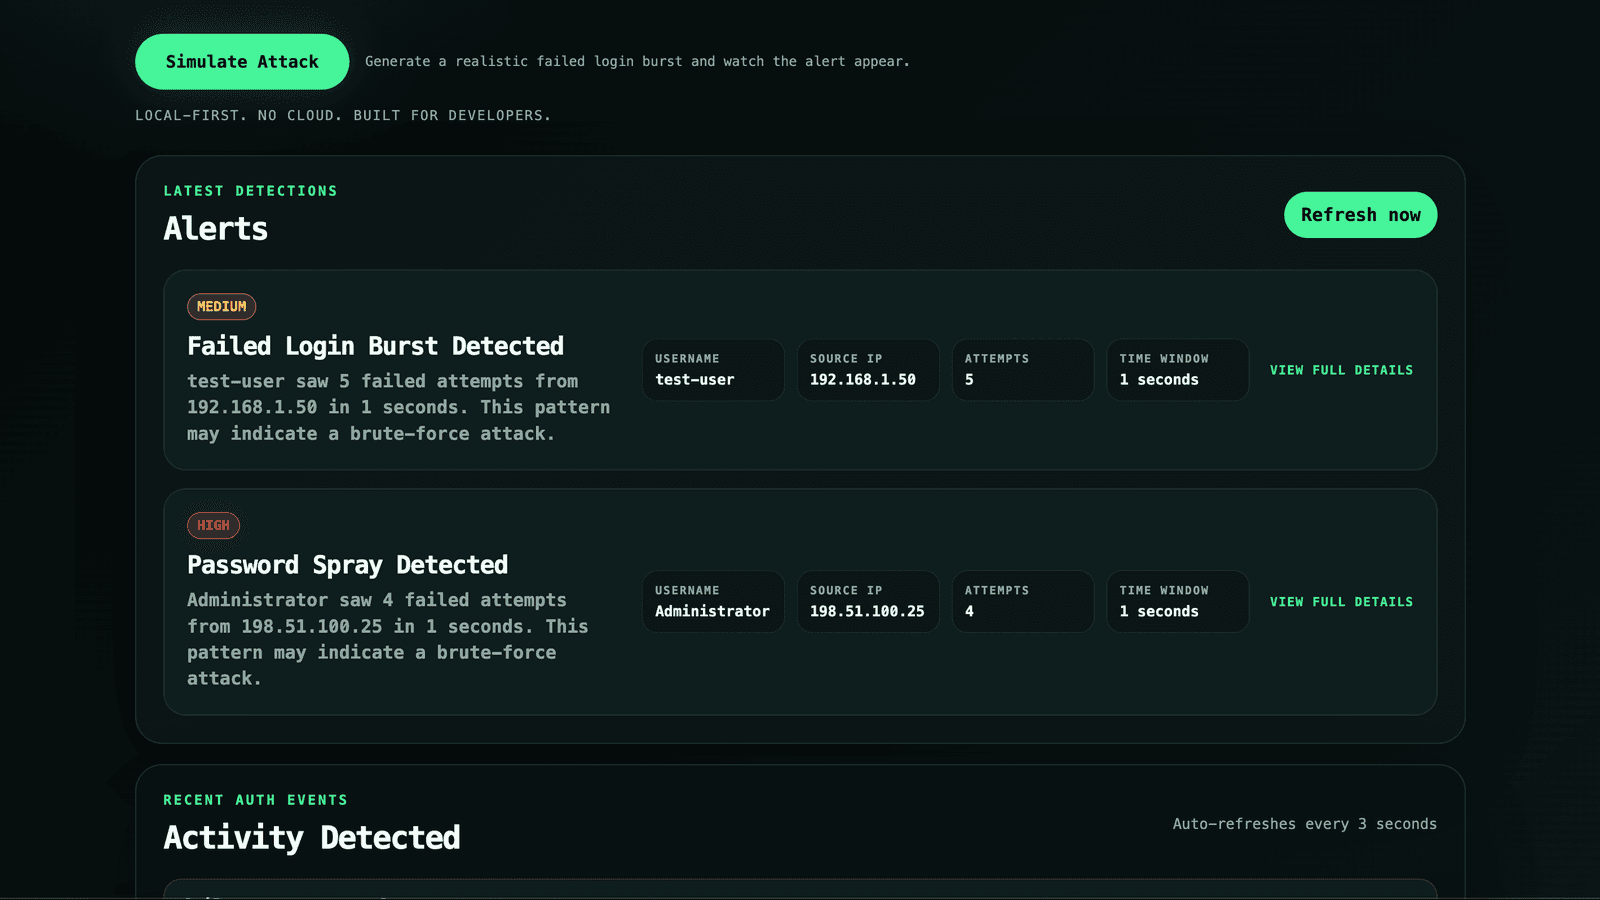
The product in use.
Current state / next work
What exists, and what follows.
Prototype
Started Q1 2025 · Last updated June 2026
Next direction
- Expand detection coverage and alert routing ergonomics.
- Improve replay and triage workflows for investigations.
- Add richer operator dashboards for pipeline health and rule feedback.
Detection quality depends on operational clarity as much as rule logic.
Working lesson / Hayabusa